
Do the standard reports from your ERP work?
No, most of the standard reports which are developed during an ERP implementation do not help the financial user(s) during the time of busy month-ends or for any analysis.
Generally, the reports are run in ERP systems but get published in Microsoft Excel to perform calculations and reviews. This is a very time consuming and tedious process.
Why do we need Smart reports?
Now, when the business expands, the demand for new reports from the Finance department also increases during quarter-end and year-end. At times, the Finance department sends the request to the IT department to develop new reports which come with a heavy cost. By the time a report is generated after testing, a new request arises and leads to errors in a reconciliation and communication gap between the IT and Finance teams.
Oracle Fusion has introduced an Excel Ad-din known as “Smart View” which gives the flexibility to develop reports in MS Excel.It is a user-friendly tool where a user can connect to Oracle through Excel and create their own reports.
The following are some of the key features of “Smart View”.
Essbase Database: Smart view reports are linked with the Essbase database of multi-dimensional cubes.
Drag and drop: It is a simple way of creating reports, right-clicks on any dimension, drag and drops to choose as column and row. This is an easy way to finalize the rows and columns in the report
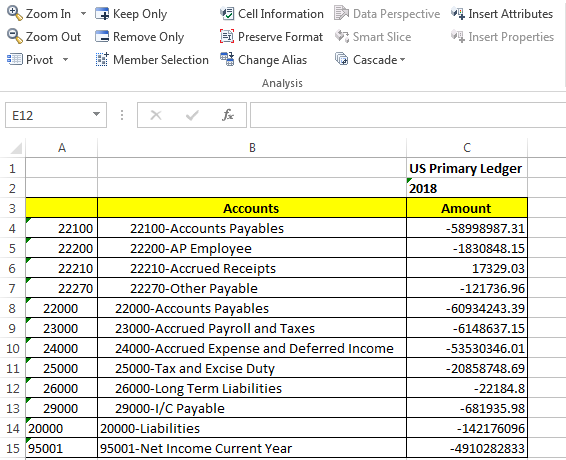
Zoom In -Zoom Out: This helps in analyzing the reports as a user can click on any column or row and then zoom in to look for detailed information of the child value(s) under any parent account or can summarize a group of values into a parent value by Zooming out.
Pivot: This function helps in creating separate tables by using existing data and allows a user to change columns into rows and vice-versa.
Keep and Remove Only: This feature is very handy to review and analyze the report if a report has a lot of information on the sheet and a user wishes to analyze the specific set of details.
Cascade: Cascade existing reports based on selected members from the POV dimension and generate new reports. For example, a user has a sales report by country and wishes to see the same sales report by state, the cascade function will help generate multiple reports for different states in different workbooks.
Apart from this, the smart view has many features to create financial reports easily.
Blog Post by vali basha, Forsysinc.